01 / The missing middle
The final frame can hide the most useful part of an experiment: how the system got there.
In this Cell Cinema pilot, two chemical contrasts cross the same relative threshold in a recurring order across all seven measured fields. Their timing varies. The ordering, at half baseline, does not. An eight-hour endpoint alone cannot show that history.
Here is the experiment: living SK-MEL-2 melanoma cells exposed to RSL3, with their spatial chemistry measured repeatedly over eight hours. The images are not conventional fluorescent stains. Each sampled location contains a molecular-vibration spectrum; a displayed color is a selected chemical contrast from that spectrum. Heme-associated contrast can respond to heme-containing molecules and their state. The broad carbon-hydrogen (CH) contrast reflects contributions from many cellular molecules. Neither is a direct assay of survival.
We revisited this oxidative-stress time course, going back to the original spectral measurements rather than treating a rendered movie as the evidence. The public view below contains seven spatial fields, each sampled at 17 observations across eight hours. These are repeated two-dimensional chemical maps: at every sampled location, a spectrum carries more information than the color we choose to display.
The seven fields belong to one pilot run, not seven independent experiments. We can describe their measured histories confidently. Establishing what those histories predict requires new experiments.
A deeper audit adds a spatial lead: locations with higher initial heme-associated contrast subsequently retain less of a separate heme-associated readout, while their broad CH retention is much closer. The question expands from what changes first? to could the starting map help predict where change happens next?
Our larger bet is a change in the unit of observation: from a cellular snapshot to a chemically informative history. Not just where the signal ended, but its starting state, direction, timing, and path.
02 / The result across fields
Seven fields.
A recurring order.
At the 50% threshold, the first sustained below-threshold observation occurs earlier for the heme-associated signal than for CH in 7 of 7 fields. This result uses locally corrected, signed contrast values, not the brightness of a pseudostain.
At 30% of initial contrast, all seven fields retain the same sampled ordering. At 70%, six retain it and one falls within the same 30-minute bracket. These are exploratory sensitivity checks, not independent replications or a significance test.
That is the lead worth following: a recurring order despite variable timing. It is not yet a molecular sequence. Shared processing effects, spatial movement, and measurement-induced changes could also produce a pattern within one run. The next test is whether the ordering survives independent runs, alternative preprocessing, tracking, and matched controls.
03 / The spatial lead
The clock has
a geography.
The next question was not just when a signal changed, but where. Could the starting chemical map tell us which locations would change most?
Within each RSL3 field, we compared locations with higher and lower initial heme-associated contrast relative to CH, while approximately matching their initial CH brightness. We selected those groups using one heme-associated contrast and followed a different one. That separates the selection signal from the readout, although it cannot remove shared noise or all selection effects.
Evidence 02 / RSL3 / 90 minutes
Different heme retention.
Similar CH retention.
Signal remaining, relative to each group's own baseline
Heme-associated
Separate contrast used for readout
Broad CH
The same two location groups
The heme-associated readout retained a smaller fraction of its starting value in the initially higher group in all seven fields. The CH comparison was much closer at the group-median level. The map is therefore suggesting a more specific question than whether the whole field simply became dimmer.
How far does this pattern hold?
The direction held in all seven fields in 17 of 18 exploratory combinations of region selection, background correction, and translation checks; six of seven in the remaining combination. Redefining the groups at 30 minutes and comparing them at 90 minutes preserved the direction in six of seven fields.
Across the four time-course pilots, the main comparison had the same direction in 17 of 18 fields, at the available 80- or 90-minute observation. Different conditions and acquisition histories make that a broader lead, not independent replication or evidence of drug specificity.
Working hypothesis: initial chemical organization is associated with where the subsequent response is largest. If that association predicts new experiments after motion and measurement controls, an initial map could become a way to choose where to look next, not merely a reference image.
That is not yet a map of vulnerability. Selecting extreme starting values can produce regression toward the mean; correlated noise, redistribution, and local illumination effects remain alternatives. Repeated baseline maps, reliable tracking, matched controls, and independent outcomes are the tests that would make this useful.
04 / Two different clocks
First, a signal changes.
Then, the question changes.
Take Field 04. Its heme-associated contrast first falls below half its initial value, and stays below that level at subsequent sampled observations, between 60 and 90 minutes. The broad CH contrast crosses the same relative threshold between 120 and 150 minutes.
Those are sampling brackets, not precise event times. The separation is visible in the acquired observations. Its biological meaning is still open.
A heme-associated spectral signal is not a direct count of mitochondria, nor proof that cytochrome c has left them. In a different drug and cell model, published Raman work linked a decline in reduced cytochrome-c signal to oxidation before release.1 That makes an early redox-related change a plausible explanation here, not an established one. Redistribution, changing morphology, drift, and measurement effects remain alternatives.
Likewise, the CH envelope is a broad chemical contrast, not a survival assay. Its decline does not assign a time of death. But the difference in timing gives us something that the final frame cannot: an interval to interrogate.
What if the useful biomarker is not the height of a peak, but the interval between two changes?
That is our working hypothesis. To earn the word biomarker, the interval would have to predict an independently measured outcome in new experiments. At present, it is a candidate feature with a specific test.
05 / Other response states
The same exposure does not imply the same clock.
There is another difference worth looking at. Field 06 crosses the CH half-baseline threshold between 30 and 60 minutes. Field 03 crosses between 180 and 210 minutes. Both show strong contrast loss later in the run. Their histories are not interchangeable.
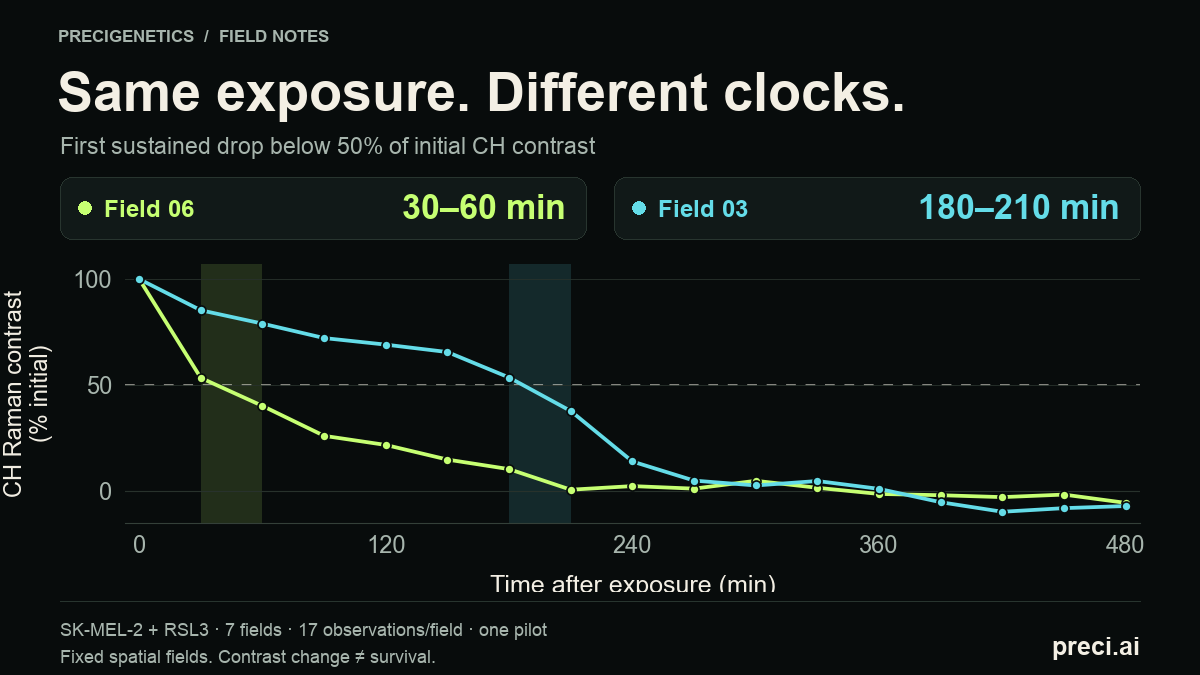
It would be tempting to label these fast-dying and resistant cells. That would go beyond the data. These are fixed spatial regions, not independently tracked cell identities, and we have not measured recovery. A slower decrease could reflect a different response, a different starting composition, cell movement, local exposure, or a technical difference.
The useful distinction is subtler: are we seeing the same sequence at different speeds, or different sequences altogether? That is a question for joint trajectories, not a contest to find the brightest frame.
There is biological precedent for nonuniform responses. Published work under GPX4 inhibition has documented ferroptotic and apoptotic features in distinct cellular subsets.2 We are not claiming to have identified those fates here. The precedent is a reason to test heterogeneity carefully, rather than average it away.
A second pilot makes the contrast harder to ignore.
In a separate SK-MEL-2 vemurafenib time course, three fields retained 86%, 22%, and 21% of their initial broad CH contrast at 80 minutes. Whole-field and translation-adjusted checks preserved the qualitative separation. This is another timing lead, not a comparison of drug potency and not evidence of resistant and sensitive lineages. Focus, attachment, and starting-state differences still need controls.
A late frame is not a fate.
The daily drug panel raised a different question. Two selected 48-hour fields, one under retinoic acid and one under encorafenib, retained broad CH and lipid-associated features while showing relatively weak heme-associated contrast. The lipid-associated features remained positive across three region-selection checks. These are individual outliers, not a condition-wide result.
Hypothesis: a late, chemically persistent state may reflect remodeling rather than uniform signal loss. But residual material, debris, or deposits could look similar. Matched brightfield, an independent lipid assay, material controls, and viability or recovery measurements must distinguish those explanations. We are not calling this peroxidation or survival.
The daily panel contains different fields at different days. A shared initial reference does not make them the same cell followed over time. These endpoints generate a question; they do not show a transition into the proposed state.
06 / The next experiment
State, not only the stopwatch.
Much of an experiment is scheduled by elapsed time: add a compound, wait a specified interval, collect an endpoint. Our proposal is to test a second schedule, one triggered by a measured state.
Suppose an independently validated early chemical transition occurs while a broader contrast remains elevated. Does intervention at that state lead to a different outcome than intervention at the same clock time in every field? The present pilot cannot answer that. It tells us where to ask.
Hypothesis / Not yet tested
The interval carries information beyond intensity.
A larger separation between early and later transitions may predict a different capacity to recover. Test whether the interval improves out-of-experiment prediction beyond dose, starting state, and individual signal amplitudes. Reject the added-value claim if it does not.
Hypothesis / Not yet tested
Response order separates states that endpoints merge.
Two fields with similar late contrast could have different transition ordering. Test this in independently tracked cells with orthogonal fate measurements. If apparent ordering vanishes after drift control and measurement uncertainty, the proposed distinction fails.
Hypothesis / Not yet tested
A state-triggered intervention beats a fixed-time intervention.
Randomize rescue or washout using prespecified chemical-state thresholds versus matched time-based schedules. Control exposure and measure subsequent recovery independently. A reproducible benefit would turn a descriptive trajectory into an actionable decision.
Hypothesis / Not yet tested
The starting map predicts the location of later change.
Define spatial groups before treatment in independent runs, then test whether initial chemical organization predicts later local change beyond initial brightness, motion, and measurement exposure. Link those locations to independently measured cellular outcomes. Reject the predictive claim if the association disappears under those controls.
These are hypotheses for our research program, not claims of worldwide priority. Their value is that they can be wrong in a useful, measurable way.
The experiment must also test the measurement.
There is a critical alternative to a drug-driven clock: part of the chemical change could be induced by observing it. Primary work in living yeast has shown illumination-dependent changes in cytochrome Raman signals.4 That different model establishes a plausible confound, not evidence that photodamage occurred in this pilot.
Our priority control is to cross drug versus vehicle with lower versus higher scan exposure or cadence, comparing matched elapsed times. A pattern that follows measurement exposure more closely than treatment would weaken a drug-response interpretation. A convincing hypothesis should survive that experiment, not avoid it.
This is also the kind of problem where machine learning should face a demanding test. A model must predict a held-out experiment's future, not recognize neighboring frames from a run it has already seen. Entire runs, conditions, and relevant biological contexts belong on the other side of the validation boundary.
The ambition is not a model that produces a convincing movie. It is a model that tells an experimenter which next action would be most informative, and survives prospective testing.
07 / The bigger bet
A history can become
a training example.
A snapshot describes a state. A repeated measurement adds a direction. A perturbation adds a question. An independently measured outcome tells us whether the answer mattered.
That is the data object we want to build: starting state, perturbation, chemical history, outcome. With reliable cell tracking, it becomes possible to test what a model learns from an individual cell's measured past, rather than only from a population assembled at an endpoint.
Chronological differences between acquired maps are observations. A smooth path between them is an interpolation. A forecast beyond them is a prediction. Keeping these categories separate is essential if the record is to train a useful model.
The direction is complementary to destructive molecular assays, not a claim to replace them. Rich endpoint measurements can anchor molecular interpretation; repeated optical measurements can retain temporal context. Other live-cell methods also capture dynamics. Our focus is the combination of spatial chemistry, repeated measurement, and an explicit experimental history.
The ambition is not a prettier picture of a cell.
It is a better training example for how a cell responds.
The decisive benchmark is not a striking embedding. It is whether adding that history improves a prespecified decision in held-out biological experiments, compared with the same model given only the initial and final observations. That benchmark remains ahead of this pilot.
08 / What it would take
A better question for toxicity.
For a toxicity program, the future use case is not simply detecting a low final signal. It is distinguishing a reversible excursion from a persistent or progressing injury, early enough to change a decision.
A transient response and a sustained response may require different follow-up experiments even if their final readouts are similar. Time-resolved chemistry could help prioritize those experiments, provided its trajectory features are tied to independent functional outcomes.
This cancer-cell pilot does not validate a toxicity assay. That would require relevant healthy-cell and tissue models, exposure controls, biological replication, orthogonal functional measurements, and prospective tests across compounds. Clinical prediction is a further claim again.
Nor do these colors establish where lipid peroxidation is happening. Primary work has used complementary chemical imaging and oxidation-sensitive probes to resolve a spatial sequence of peroxidation.3 That is a standard for validation, not permission to call every bright pixel oxidized.
What these observations contribute is a concrete experimental lead: a chemical response can have an internal timing structure and a spatial pattern. The next experiment can be designed around both.
The endpoint tells us where we arrived.
The trajectory helps us decide what to test next.
09 / Evidence & methods
What is measured.
What is still a hypothesis.
Measured
Seven two-dimensional fields from one oxidative-stress pilot, with 17 acquired observations at nominal 30-minute intervals across eight hours. A map takes a finite interval to acquire; it is not an instantaneous whole-cell exposure.
Derived
Three chemical contrasts, locally corrected for spectral and spatial background. Curves use a fixed initial high-signal region and are normalized to each contrast's initial value. Negative corrected values are retained.
Displayed
Quantized, clipped spatial previews with channel scaling held fixed across fields and time. Colors encode chemical contrasts, not verified organelles. Smoothing changes display sampling, not measured resolution. Lines connect observations; they are not additional measurements.
Unresolved
Cell identity and motion, photochemical effects, drift, biological replication, molecular specificity, and independent fate or recovery. A threshold bracket is a descriptive summary, not a kinetic rate or death time.
Half-baseline brackets refer to the first sampled drop below 50% of initial corrected contrast that remains below 50% at all subsequent sampled observations. They are sensitive to the chosen threshold and observation schedule. Spatial display clipping is not used to compute the signed curves.
The all-field sensitivity view applies the same retrospective rule at 30%, 50%, and 70% of initial contrast. These three thresholds were checked during exploratory analysis, not preregistered. Their brackets agree between full-precision analysis values and the rounded public summaries. A sustained crossing is known only after later observations; it is not a validated real-time trigger.
The expanded exploratory audit covered 238 acquired time-course maps across 18 fields in four pilots, plus 46 daily-panel endpoint fields. The interactive timing charts above remain the original seven-field RSL3 pilot. Conditions were not independently replicated; neither pixels nor fields are independent biological replicates. Selection and sensitivity checks were retrospective, not preregistered.
For the spatial comparison, locations were grouped by initial heme-associated contrast relative to CH within approximate initial-CH brightness strata. A separate heme-associated contrast was used for follow-up. Within each field, each group's mean follow-up signal was divided by that same group's mean baseline signal. The graphic reports rounded medians of those seven field-level fractions. Changing denominators, correlated spectral noise, and selection of baseline extremes remain limitations. Exact spectral definitions and per-location arrays are not part of the public release.
We are publishing a curated, processed view so the observation and its limits can be inspected. Raw spectral cubes, full source spectra, acquisition configuration, exact spectral definitions, and private analysis implementation are not part of this release. The new figures expose only rounded group summaries. The measured maps and reported quantitative results are not generated cell images or imputed observations.
Further reading
- Li et al. Analytical Chemistry (2022). Raman investigation of cytochrome-c changes during apoptosis. A different perturbation and model; mechanistic context, not validation of this pilot.
- Qiu et al. Cell Death & Differentiation (2025). Heterogeneous cell-death responses under GPX4 inhibition, evaluated with independent mechanistic assays.
- Identification of essential sites of lipid peroxidation in ferroptosis. Nature Chemical Biology (2023). Spatial chemical imaging and complementary oxidation-sensitive measurements.
- Okotrub & Surovtsev. Journal of Photochemistry and Photobiology B (2014). Illumination-dependent photobleaching of cytochrome Raman lines in living yeast. A measurement-control rationale, not a diagnosis of our samples.